Stochastic Trendline Indicator for MT4 and MT5
TrueTL Stochastic Trendline indicator finds Stochastic trendlines and draws them in the Stochastic window. It calculates the Stochastic %K and %D lines, detects trendline breakout and approach events, and provides optional arrows, vertical lines, alerts, multi-timeframe calculation, and EA-ready signal buffers.
The indicator is built for traders who want Stochastic trendline structure without drawing every line manually. It can show all trendlines, only upward trendlines, only downward trendlines, or hide labels for a cleaner chart. Breakout and approach signals can be used visually, through alerts, or from an Expert Advisor.
Key features:
- Works in both MetaTrader 4 and MetaTrader 5.
- Finds and draws Stochastic trendlines automatically in the indicator window.
- Detects trendline breakout and Stochastic approach-to-trendline events.
- Built-in Stochastic %K and %D calculation with K period, D period, slowing, MA method, applied price, and bar shift settings.
- Multi-timeframe support with step, linear, smooth, weighted, and SMA interpolation modes.
- Works with normal candle charts and offline charts such as Renko or block charts.
- Triangle mode can keep the chart cleaner by drawing only two trendlines.
- 5 configurable signal slots. Each slot has its own buffer, arrow color, vertical line option, and alert timing.
- Signal types include Stochastic crosses, level crosses, direction changes, peaks/valleys, trendline breakout, and Stochastic approach to trendline.
- Alerts can be sent by popup, push notification, email, sound, Telegram, CSV file, and chart pictogram.
- Force refresh and smart HTTP/cache modes help keep visual backtesting and repeated testing faster (more info).
- All trendline styles, signal arrows, Stochastic line styles, and the show/hide button are controlled from the Inputs tab.
EA and iCustom usage:
The indicator is ready for Expert Advisor integration through iCustom(). The first two buffers return the Stochastic lines. Buffers 2-6 return the five user-configurable signal slots, so an EA can read only the events you select in the inputs.
For example, Signal 1 can be set to trendline breakout, Signal 2 to Stochastic approach to trendline, Signal 3 to a Stochastic level cross, and the EA can read those events from separate buffers. This keeps manual trading, alert trading, and automated trading aligned with the same indicator settings.
- Buffer 0:
Stochastic %K (or dynamic)main line. - Buffer 1:
Stochastic %D (or dynamic)signal line. - Buffer 2:
Signal 1buffer. Returns1or-1based on the selected Signal 1 setting. - Buffer 3:
Signal 2buffer. Returns1or-1based on the selected Signal 2 setting. - Buffer 4:
Signal 3buffer. Returns1or-1based on the selected Signal 3 setting. - Buffer 5:
Signal 4buffer. Returns1or-1based on the selected Signal 4 setting. - Buffer 6:
Signal 5buffer. Returns1or-1based on the selected Signal 5 setting.
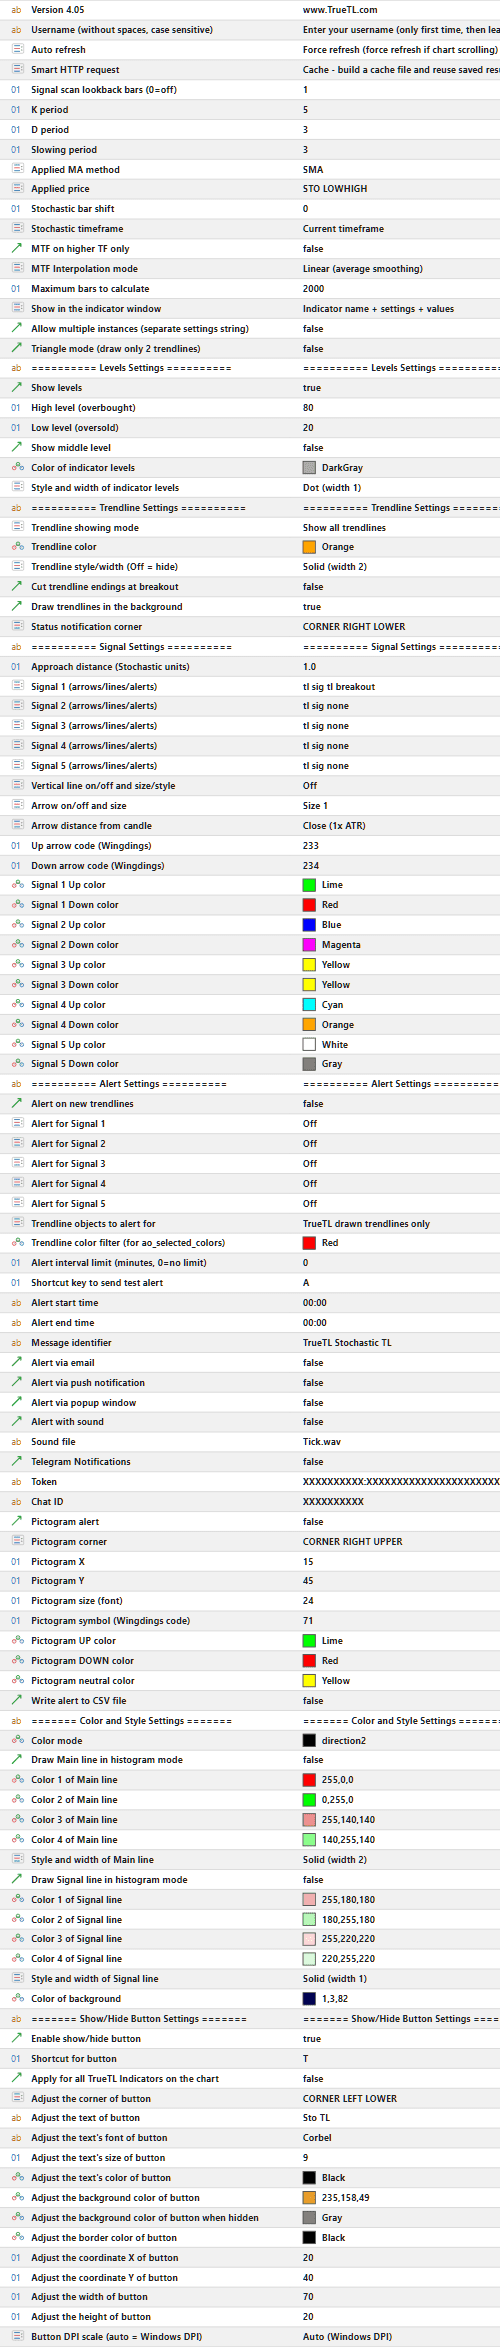
Indicator Inputs
- Version: shows the installed indicator version. If support asks for your version, this is the value to check.
- Username (without spaces, case sensitive): enter the username you received after purchase. After the first successful activation, you can usually leave it unchanged in other instances (about our ex4 protection).
- Auto refresh: controls when server-side trendline objects are refreshed.
Offdisables automatic refresh.Onrefreshes when needed after closed bars.Force refreshalso refreshes while you scroll the chart. This is useful during visual backtesting (Example Video). - Smart HTTP request: controls how often the indicator sends calculation requests.
Offrequests calculation on every bar. Use this if you want the most direct mode.Estimateskips requests when the indicator is very likely not to need a new object. This is faster.Cachesaves and reuses previous results for the same symbol, timeframe, and settings. This is usually the fastest for repeated tests.Cache resetrebuilds the cache for the current symbol, period, and settings. - Signal scan lookback bars: controls how many recent bars are rescanned for live trendline breakout signal buffers and visual signal drawing.
0turns this scan off. - K period / D period / Slowing period: set the Stochastic calculation. K period controls the main range, D period smooths the signal line, and Slowing period smooths the main %K line.
- Applied MA method: selects the smoothing method used by the Stochastic calculation:
SimpleExponentialSmoothedLinear weighted - Applied price: selects the Stochastic price formula.
Low/Highuses the candle high-low range.Close/Closeuses close prices. - Stochastic bar shift: shifts the Stochastic calculation by the selected number of bars. Most users should keep this at
0. - Stochastic timeframe: selects the timeframe used for the Stochastic calculation. It can use the current chart timeframe, fixed timeframes, or relative lower/higher timeframe presets.
- MTF on higher TF only: when enabled, multi-timeframe mode is applied only if the selected Stochastic timeframe is higher than the chart timeframe.
- MTF Interpolation mode: controls how values from another timeframe are placed on the current chart.
Offkeeps step-like values.Linearconnects values evenly.Smoothuses smoother transitions.Weightedgives more weight to closer source bars.SMAsmooths values with a period based on the timeframe ratio. - Maximum bars to calculate: limits how many bars are calculated. A lower value can improve performance. A higher value gives more history.
- Show in the indicator window: controls the label shown in the indicator window. Use
Allow multiple instancesif you want to run more than one copy on the same chart. Available options are:Only "TrueTL"Indicator nameIndicator name + settingsIndicator name + settings + valuesIndicator name + values - Allow multiple instances: allows several Stochastic Trendline indicators on the same chart by giving each instance its own settings identity.
- Triangle mode: draws only two trendlines. Use it when you want a simpler, cleaner view.
Levels Settings
- Show levels: shows or hides the Stochastic reference levels in the indicator window.
- High level (overbought) / Low level (oversold): set the upper and lower Stochastic zones. These levels are used for display, coloring, and level-cross signals.
- Show middle level: adds the middle level between the high and low levels. With the default 80/20 settings, the middle level is 50.
- Color of indicator levels / Style and width of indicator levels: set the color, style, and width of the level lines. Available line styles include solid, dash, dot, dash-dot, and dash-dot-dot.
Trendline Settings
- Trendline showing mode: chooses which trendlines remain visible:
Show all trendlinesShow all trendlines without labelsShow only upward trendlinesShow only upward trendlines without labelsShow only downward trendlinesShow only downward trendlines without labels - Trendline color: sets the default trendline color.
- Trendline style/width: sets the line preset used for trendlines.
Offhides trendlines. Other styles include solid, dash, dot, dash-dot, and dash-dot-dot. - Cut trendline endings at breakout: shortens trendlines at the breakout point, so the chart shows where the break happened more clearly.
- Draw trendlines in the background: places trendline objects behind candles and other chart drawings.
- Status notification corner: sets where chart-side status messages are shown.
Signal Settings
- Approach distance (Stochastic units): sets how close the Stochastic line must come to a drawn trendline before an approach signal can trigger.
- Signal 1 / Signal 2 / Signal 3 / Signal 4 / Signal 5: each signal slot can watch a different event. Each slot has its own iCustom buffer, arrow color, vertical line output, and alert timing. Available events are:
NoneMain line direction changeSignal line direction changeBoth lines direction changeLines cross each otherMain line cross high levelMain line cross mid levelMain line cross low levelMain line cross any levelSignal line cross high levelSignal line cross mid levelSignal line cross low levelSignal line cross any levelBoth lines cross high levelBoth lines cross mid levelBoth lines cross low levelBoth lines cross any levelMain line peak/valleySignal line peak/valleyTrendline breakoutStochastic approaches trendline - Vertical line on/off and size/style: draws an optional vertical line on signal bars. Use it when you want signals to remain easy to see during chart review.
- Arrow on/off and size: draws signal arrows on the main chart. Arrow size can be set to
Size 1-8, or turned off. - Arrow distance from candle: controls how far arrows are placed from candles. ATR-based distance adapts to volatility. Point-based distance uses fixed point values.
- Up arrow code / Down arrow code: set the Wingdings symbols for bullish/up and bearish/down signal arrows. Defaults are
233for up and234for down. - Signal 1-5 Up color / Signal 1-5 Down color: assign separate bullish and bearish colors to each signal slot. This is useful when several signals are active at the same time.
Alert Settings
- Alert on new trendlines: sends an alert when a new Stochastic trendline is detected. This works independently from the five signal slots.
- Alert for Signal 1-5: sets alert timing separately for each signal slot:
OffAfter candle closedBefore candle is closingBoth - Trendline objects to alert for: selects which chart objects are monitored by trendline breakout and approach alerts:
TrueTL drawn trendlines onlyAll trendlines and horizontal linesSelected trendline colors only - Trendline color filter: defines the monitored object color when trendline alerts are set to selected colors.
- Alert interval limit (minutes, 0 = no limit): prevents repeated alerts from firing too often.
0disables the interval limit. - Shortcut key to send test alert: lets you send a test alert from the chart with a keyboard shortcut. Available keys are
0-9andA-Z. - Alert start time / Alert end time: limits alerts to a daily time window.
00:00to00:00means alerts are allowed all day. - Message identifier: adds a short label to alert messages. This is useful when several charts, symbols, or indicator instances are running.
- Alert via email / Alert via push notification / Alert via popup window / Alert with sound / Sound file: enable the MetaTrader alert channels and select the sound file for sound alerts.
- Telegram Notifications / Token / Chat ID: enable Telegram delivery and define the bot token and destination chat ID.
- Pictogram alert: shows a chart-corner symbol that changes with the latest alert direction.
- Pictogram corner / Pictogram X / Pictogram Y / Pictogram size / Pictogram symbol: control the position, size, and Wingdings symbol of the pictogram alert.
- Pictogram UP color / Pictogram DOWN color / Pictogram neutral color: set the bullish, bearish, and neutral pictogram colors.
- Write alert to CSV file: writes alerts to a CSV file in the platform files folder for later review or external automation.
Color and Style Settings
- Color mode: controls how the %K and %D lines are colored. Available modes are:
Simple colorCrossCrossed after closedCross on selected timeframeCrossed after closed on selected timeframeOnly directionDirection with levelsOnly levels - Draw Main line in histogram mode: displays the Stochastic %K main line as a histogram instead of a line.
- Color 1-4 of Main line: set the four possible color states for the %K main line. The active color depends on the selected Color mode.
- Style and width of Main line: selects the line style and width for the %K main line.
- Draw Signal line in histogram mode: displays the Stochastic %D signal line as a histogram instead of a line.
- Color 1-4 of Signal line: set the four possible color states for the %D signal line. The active color depends on the selected Color mode.
- Style and width of Signal line: selects the line style and width for the %D signal line.
Show/Hide Button Settings
- Enable show/hide button: enables the chart button used to show or hide the indicator without removing it from the chart (more info).
- Shortcut for button / Apply for all TrueTL Indicators on the chart: controls keyboard access and whether the button affects only this instance or all TrueTL indicators on the chart. Available shortcut values are
Off,0-9, andA-Z. - Adjust the corner of button / Adjust the coordinate X of button / Adjust the coordinate Y of button: sets the button position on the chart.
- Adjust the text of button / Adjust the text's font of button / Adjust the text's size of button / Adjust the text's color of button: controls the button caption.
- Adjust the background color of button / Adjust the background color of button when hidden / Adjust the border color of button: controls the button colors in visible and hidden states.
- Adjust the width of button / Adjust the height of button / Button DPI scale: controls the button size on different displays. DPI scale can be automatic or fixed from
50%to200%.


