Trading Examples And Knowledge Base
TrueTL indicators are not a complete trading system themselves. Our indicators "only" draw the trendlines, S/R levels and divergences with many options that meet the user’s unique needs. Using them is similar to drawing them manually. That’s why we can’t speak about "accuracy" or "profit/loss rate". Your balance growth depends on your trading style, money management, market situation, etc.
Here, we would like to create a compact page where beginners can find only useful, selected and basically required knowledge and advice about trading, with example strategies, and no dead ends. The content is continuously being expanded so it’s worth visiting again (but please note that we are a software developer team not an educational firm).
Our indicators:
- draw trendlines, support and resistance levels and divergences most similar to the methods of professional traders’ technical analysis on the market
- help analyze the chart for beginners
- help make decisions more quickly - it’s important if you are trading on lower timeframe
- save time and are more comfortable
- decrease the possibility of mistakes - for example when we don’t see a higher timeframe’s trendline, or a trend starts earlier than it appears on our screen, or inaccurate draws by hand, etc.
- provide signal buffers for every signal type, so you can write a custom EA directly on top of them - no need to build entry logic from scratch, just plug in your own money management
The Holy Grail Search and AI Trading Robots
For decades, most traders have been searching for a method that generates unlimited money, and fast. Typical search terms: "100% accurate indicator", "perfect buy/sell signal", "never-losing EA". Think about it:
- If someone could truly show you how to make $5,000 a day, why would they share it with you?
- If someone developed a never-losing robot, why would they sell it for $50-150?
- If someone had a perfect buy/sell indicator, why wouldn't they just build a bot from it, and why would they bother with anything else?
The answer is simple: your money. The internet is full of these ads. Whenever you see them, it's almost certain they're empty promises. Trading is fundamentally a personal journey. You need to learn the basics (trend lines, levels, candles), but the real edge lies in developing your own unique trading personality: your own strategy, unique filters, and thorough, personalized money management. It's hard work and remember: there's no such thing as free money.
Working Systems Do Exist, Just Not for You
Elite quant funds like Renaissance Medallion, Two Sigma, Citadel Securities, or D.E. Shaw are often closed or heavily restricted, and operate with massive infrastructure, research teams, and risk management. Even at this level, serious drawdowns and weaker periods occur. The reality of professional trading: 10-30% annual return is already very good, accompanied by significant drawdowns and losing months. There is no "always-winning AI".
Why Do Mass-Market Bots Fail?
- Overfitting: Parameters are tweaked on historical data until the system fits it perfectly, like knowing the lottery numbers in advance. In live markets, it collapses immediately.
- Hidden drawdown: Martingale and grid strategies show stable profits for months while a "floating loss" ticks away in the background. A single larger market move can wipe the account to zero in a single night.
- Skewed results: Out of 100 robots, 5 randomly perform well. Those are the ones they show you, the rest are kept quiet. There's a backtest screenshot, but no verified live track record.
- The market adapts: Once a strategy becomes public and masses follow it, its edge disappears. This is one of the most serious and most frequently hidden problems in the industry. Most "AI bots" aren't even real AI: RSI, moving averages, grid logic, with AI optimization slapped on as a marketing label.
What to Look for When Evaluating a System?
Green flags:
- At least 2-5 years of verified live track record (not just backtests)
- Equity curve with visible balance + floating drawdown
- Profit factor between 1.3-2 is realistic
- No hidden lot size increases
Red flags:
- "AI predicts market" / "90%+ winrate"
- Fixed daily profit, no losing months
- 100 to 1M challenge, "institutional secret"
- Only a Myfxbook screenshot, no investor password
The lesson isn't that automation is bad. It's that instead of looking for a ready-made miracle solution, it's worth thinking in terms of your own understandable and testable system. If you're not just browsing pre-built bots but want a truly lasting solution, that's where custom EA development begins. You can't fool yourself. Your own logic, your own parameters, your own testing, and if you want to change something, you change it and immediately see the result on the chart. Your numbers only lie if you want them to.
The Custom EA: Why Is This the Best Path?
Automation is a valid tool: a bot isn't a magic oracle, but an executor that eliminates the mistakes caused by greed and fear that we make in manual trading. The question isn't whether to have an EA, but which one. Once many people run the same thing, the strategy's edge disappears, and that's the death of publicly sold bots, even if they're otherwise well-built. Your custom system, however, remains yours alone. Nobody else is using the same thing against you.
"AI Will Just Code It for Me" - Or Will It?
Many people reach this conclusion: I'll just type a prompt into ChatGPT, Perplexity, or some similar tool, the AI will code everything, and I'll sit back and relax. AI can genuinely help a lot, with coding, analysis, generating images, videos, and text alike. I personally use multiple subscriptions and open-source models on a daily basis. But it cannot yet replace years of expertise and real market experience.Think it through: if you type "create a trend line indicator", the AI-generated indicator will probably draw something that resembles a trend line. But without expertise, are you sure it's a properly drawn trend line? Will the market actually respect that line? A prompt cannot replace the knowledge built up over decades, from understanding market structure, through thousands of losing and winning trades, and from knowing exactly when a trend line, level, or divergence is valid and when it isn't.
Which would you trust more? An AI-generated indicator that no one has ever tested, or a market product that thousands of traders have been using since 2011, under continuous development?
A Custom EA Needs Reliable Custom Signals
The true heart of an EA is money management, that's what needs to be optimized. Entry signals don't need to be built from scratch. TrueTL indicators automatically draws trend lines, support/resistance levels, and divergences with signal buffers that can be directly accessed by a robot. The Smart HTTP option saves the signals, making backtests up to 700% faster, so you can focus optimization where it belongs: money management.
Summary
A publicly sold, ready-made bot with no hidden drawdown and guaranteed profits almost certainly doesn't exist. Algorithmic trading as a profession, however, is valid, if you build it yourself, uniquely and thoroughly. The illusion is that you don't need to do anything, just pay. The real tool is what you understand, test, shape, and use responsibly. If you're done with illusions, thinking about developing a custom and truly testable EA based on TrueTL indicators or your own strategy, and don't yet have a programmer you trust, check out my freelancer programming page and let's talk about your idea: MQL5 Freelance page or you can also reach me on the SUPPORT page.
About Risk Management
The initial risk is the only thing in forex trading that we can control accurately. Most beginner traders are focusing only on the good buy/sell signal and looking for the holy grail. Win-only entry doesn't exist, our profit comes from the equity curve that consists of more time and/or bigger amount of winning positions and less time and/or smaller amount of losing positions. So in the long run, our account's equity can only grow with an engineered and tested risk management method that considers our entry signal. As anything in forex trading it also includes many humanly decisions, and many alternative methods exist (such as grid/martingale/hedge combinations), but we prefer the conservative way of thinking. Here are some points of our view:
Determine The Initial Stop Loss
Most beginner traders enter a position without Stop Loss (SL) and believe that the instrument will go in the good direction. This can cause a margin call on the trading account which means the account balance reaches 0 or below, therefore any position without Stop Loss is absolutely not recommended. Professional traders recognize the price movement that is not taking shape according to their original plan, so they don't risk their entire account, instead they realize the predefined loss. After we place the Stop Loss, we should never move it in the wrong direction, so we won’t increase the initial risk. On many websites we can read about fixed amount of pips for Stop Loss for every position in any market situation, but we think that it's a wrong way, because the market is changing continuously. For example the EURUSD usually moves only 30-40 pips in a day, but sometimes it can move 150-200 pips. So we prefer the dynamically determined Stop Loss price on a previous peak/bottom, or pivot point, trendlines or S/R levels, etc. The prices could differ minimally between brokerage firms, so we suggest that the real Stop Loss price be 2-4 pips above / below the price determined by our chart to prevent "Stop Hunting". Another reason why we always have to use Stop Loss: it protects us from the instability of Internet connection or the power interruption or from any other technical errors.

Determine The Possible Target Price
Find the first price from which the instrument might not move in our direction anymore. Like the initial Stop Loss, this can also be the next trendline, S/R level, pivot, etc. We can use Take Profit (TP) or close the position manually, it's less important than the usage of SL.
Determine The Risk/reward Ratio (rr Ratio)
The risk is the distance between the entry price and the Stop Loss price. The reward is the distance between the entry price and the Target Price. With these we can calculate the risk/reward ratio: if the Stop Loss distance is 40 pips, and the Target distance is 80, then our Risk/Reward ratio is 1:2, or if the Stop Loss price is 30 pips from the entry and the Target price is 10 pips, then our Risk/Reward ratio is 3:1. Basically the good RR ratio is higher than 1:1, but it depends on our entry signal's quality (hit rate) and our position management method (see below). We have to make statistics deriving from these to know the RR ratio that is required for our entry.

Calculate The Position's Lot Size
Most professional traders prefer not to use fixed lot. If we know that the Stop Loss distance is 20 pips and in another case it is 60, then we do not enter with the same amount of lots, because in the second case we can lose 3X more money than in the first case. So it's a better way to determine the percentage of our equity that we want to risk with the initial SL. For the accurate calculation we need the following information:
- Our account's equity. It is not the same as balance because the equity contains all opened positions' profits and losses (floating positions), while the balance only contains the closed positions.
- Predefined percentage of risk. We suggest that the maximum amount of risked money be 3% of the account's equity.
- Stop Loss distance in pips between the entry price and the Stop Loss price.
- Tick value (Pip value) that shows how much change a point movement per standard lot can cause in our account's currency.
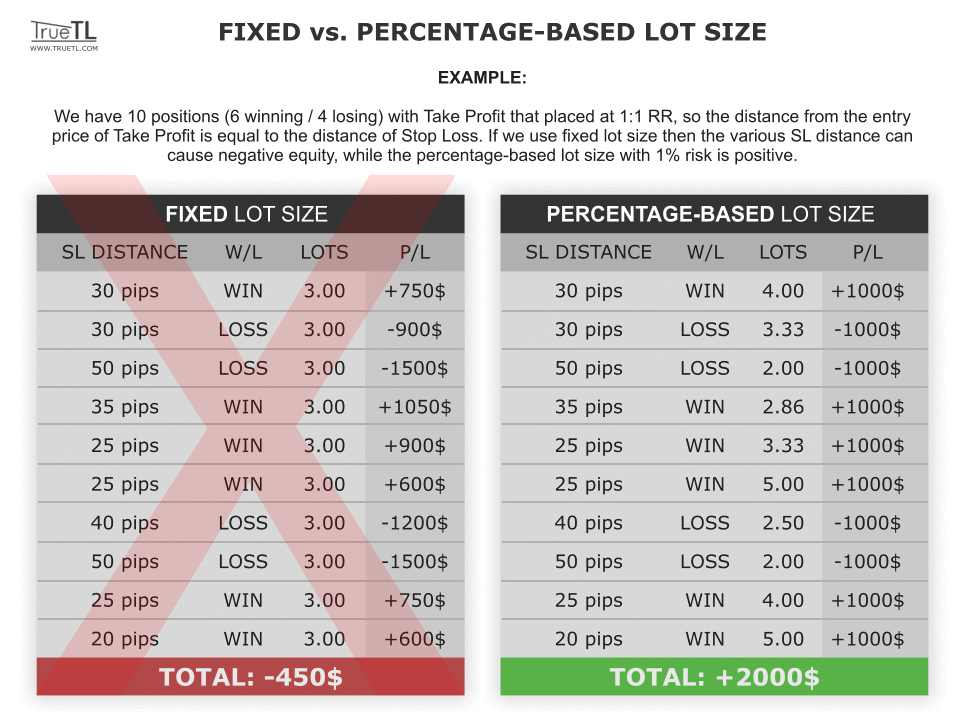
LOT SIZE = EQUITY * RISK / SL DISTANCE / TICK VALUE
For example: our account's equity is 10.000$ and we want to risk 1% of this. If the Stop Loss distance is 20 pips on EURUSD then we will open the position with 0.5 lot, but if the distance is 40 pips then with 0.25 lot (10000 X 1% / 20 / 10 = 0.5 lot and 10000 x 1% / 40 / 10 = 0.25 lot). We can make this calculation manually, but it's more comfortable, faster and safer to use a position management software such as our Free Infoboard EA or indicator.
Position Management
We have to predefine what we will do with the opened position. This is a very sensitive area of our trading style, as our final balance growth mainly depends on it. We have to try out and test many variations. Some basic ways are:
- Define a market situation by closing the position, for example if a reversal candle pattern appears, or if the movement slows down. It's a very good method to follow the market, but it causes a higher mental load, and requires permanent attention.
- Place the Take Profit and "forget" the position. It's a simple and possibly a profitable method in the long term, as well as it's comfortable, but with this method we cannot follow the changes of the market.
- Move the Stop Loss if the position goes towards the good direction. We prefer the dynamically determined new SL price such as a new peak/bottom or a trendline, S/R levels, pivot points, Fibonacci levels etc. rather than the simple trailing stop. This method is the middle-way because it causes a lower mental load but we can follow the changes of the market.
- Define a market situation by using Scale In (increase) or Scale Out (decrease) as our position's lot size. With Scale In we can take higher profit if the market goes in the good direction, but it causes higher mental load and higher amplitude on the equity's curve. That's why this method is recommended only for advanced traders. In an uncertain market situation or at a first targeted price we can Scale Out the position's lot size, which decreases the possible profit, but also decreases our mental load.
About the Trendline
The trendline is a straight line that connects two or more price points or peaks and bottoms. This line facilitates the definition of trend direction, and in the future this line will behave as a support or resistance. The more touches a trendline has, the more accurate it is, and the stronger the price action will be.
The Most Important Formations:
- Break
- Break with backtest
- Bounce (the price turns around from the trendline)
We can use the trendlines for many things. In most cases the simple breakout on a shorter trendline (of course with some filtering) is maybe enough for entry. But the longer trendlines (so the higher timeframe's trendlines) require the backtest for confirmation after breakout, or we can use them for a turn-around. Furthermore, the trendlines are good for price targeting or as a Stop Loss place also.

About the Divergence
Divergence is when the oscillator's peak or bottom (such as RSI or CCI) cannot follow the price's peak or bottom. The divergence is a famous tool for traders, because it can forecast earlier the reversal moving, and it's able to trade with a very small size of Stop Loss distance. But at the same time it can be dangerous too if we don't use a strong filtering method, such as:
- Entry in the trend direction
- Entry at pivot points, current or previous daily high/low, or other strong levels
- Entry if the nearest peak/bottom's price or candle body is not too close
- Entry when the price moves below/above the trigger (arrowed) candle's high/low
4 Types of Divergence
- Bullish Regular Divergence
- Bullish Hidden Divergence
- Bearish Regular Divergence
- Bearish Hidden Divergence

Trendline Strategy Example
If you are a beginner trader, we can help you with this video how to start the development, and the way you think while using TrueTL. The development and testing of your strategy is a long and hard work. We're just showing a possible way to begin, but you can find a lot of other methods, it's up to you what you choose.
Some Other Resources

Our Strategies
We’ve been trading on the forex market since 2008, so we only believe in the traditional tools: peak/bottom analysis, S/R levels, candlestick patterns, trendlines, etc. We’ve seen a lot of seemingly simple strategies, magic indicators, promising robots, but we’ve never seen anyone who could earn money with them in the long term. You can find many descriptions of strategies on many sites but forex trading is more complex than just a set of rules. A "Simple London Breakout Strategy" or an "EMA Cross Strategy" in itself with a few rules can't be profitable in the long term, because they are not including some indescribable things (economy, "chart beauty", risk management, etc). These things can rewrite our basic rules sometimes, that's why it's impossible to specifically write all of them, but we can share some of our rules to give you some ideas for your strategy development.
A few of our Common Basic Rules:
- We always use Stop Loss (SL) on the previous peak/bottom level (accurately above/below with 2-3 pips that prevent the "Stop Hunting"), and we pull it when the position goes towards the "good direction" and the price makes a new high/low.
- We always check the possible target price and in most cases we place Take Profit (TP). For example it can be a next trendline, or previous peak / bottom or EMA 200 or a very strong (more than 3 touches) level.
- If the SL distance (risk) is much bigger than the TP distance (reward) from the entry price, then we don't enter. This is the Risk/Reward examination (in the future we will explain this important thing).
- The equity's risk is always max. 1% per trade.
- We are not afraid of the low/middle impact economy news release, because our systems are not sensitive to the "little confused" price moving (because the entry is strong, and the SL-TP places are good). But before high impact news we shouldn’t enter a position, or we close them if they are running.
Our Strategy #1
- Timeframe: M15 or H1, but works well on any other timeframe.
- Instruments: EURUSD, GBPUSD, AUDUSD, EURJPY, GBPJPY, USDJPY, AUDCAD, AUDJPY, CADJPY, but good for any forex pair, cfd, stocks.
- Main trigger: enter if the actual timeframe's trendline is broken, and the next trendline is not too close.
- Entry mode: pending-order or manually enter when the breakout candle is closed. The entry price is below/above 2-3 pips from the trigger candle's high/low for the confirmation.
- Trend determination: observe the place of multi timeframe 200 EMA (M1, M5, M15, H1). If the main TF's EMA is above, then we are looking for short entry only, when the EMA is below, we are looking for a long one. The other TF's EMAs are only the confirmation: if they’re too close to the entry price, then we don't enter.


Our Strategy #2
- Timeframe: M5 with H1 trendlines, but works well on any other timeframe with the higher timeframe's trendline.
- Instruments: EURUSD, GBPUSD, XAUUSD, EURJPY, USDJPY, but good for any forex pair, cfd, stocks.
- Main trigger: enter if a S/R level with 2 or more touches or a double top/bottom's neckline is broken.
- Entry mode: usually enter when the break candle is closed, but sometimes we wait while the price backtests the broken level.
- In this strategy we don't use any other methods because if a strong S/R level is broken, and the trendlines are good, then the actual timeframe's trend direction is reversed for us.


